Interfacing with LabView and a myDAQ#
By Dr Ross Mathieson, Dr Mark Quinn, Dr Stephen Collins & Amy Moores.
Now that we have an understanding of how to interact with LabView, we are going introduce the myDAQ into our script. In this session, we are going to look at how to collect data using the myDAQ and exporting this data to a useful file type.
Builing a Light Detector Circuit#
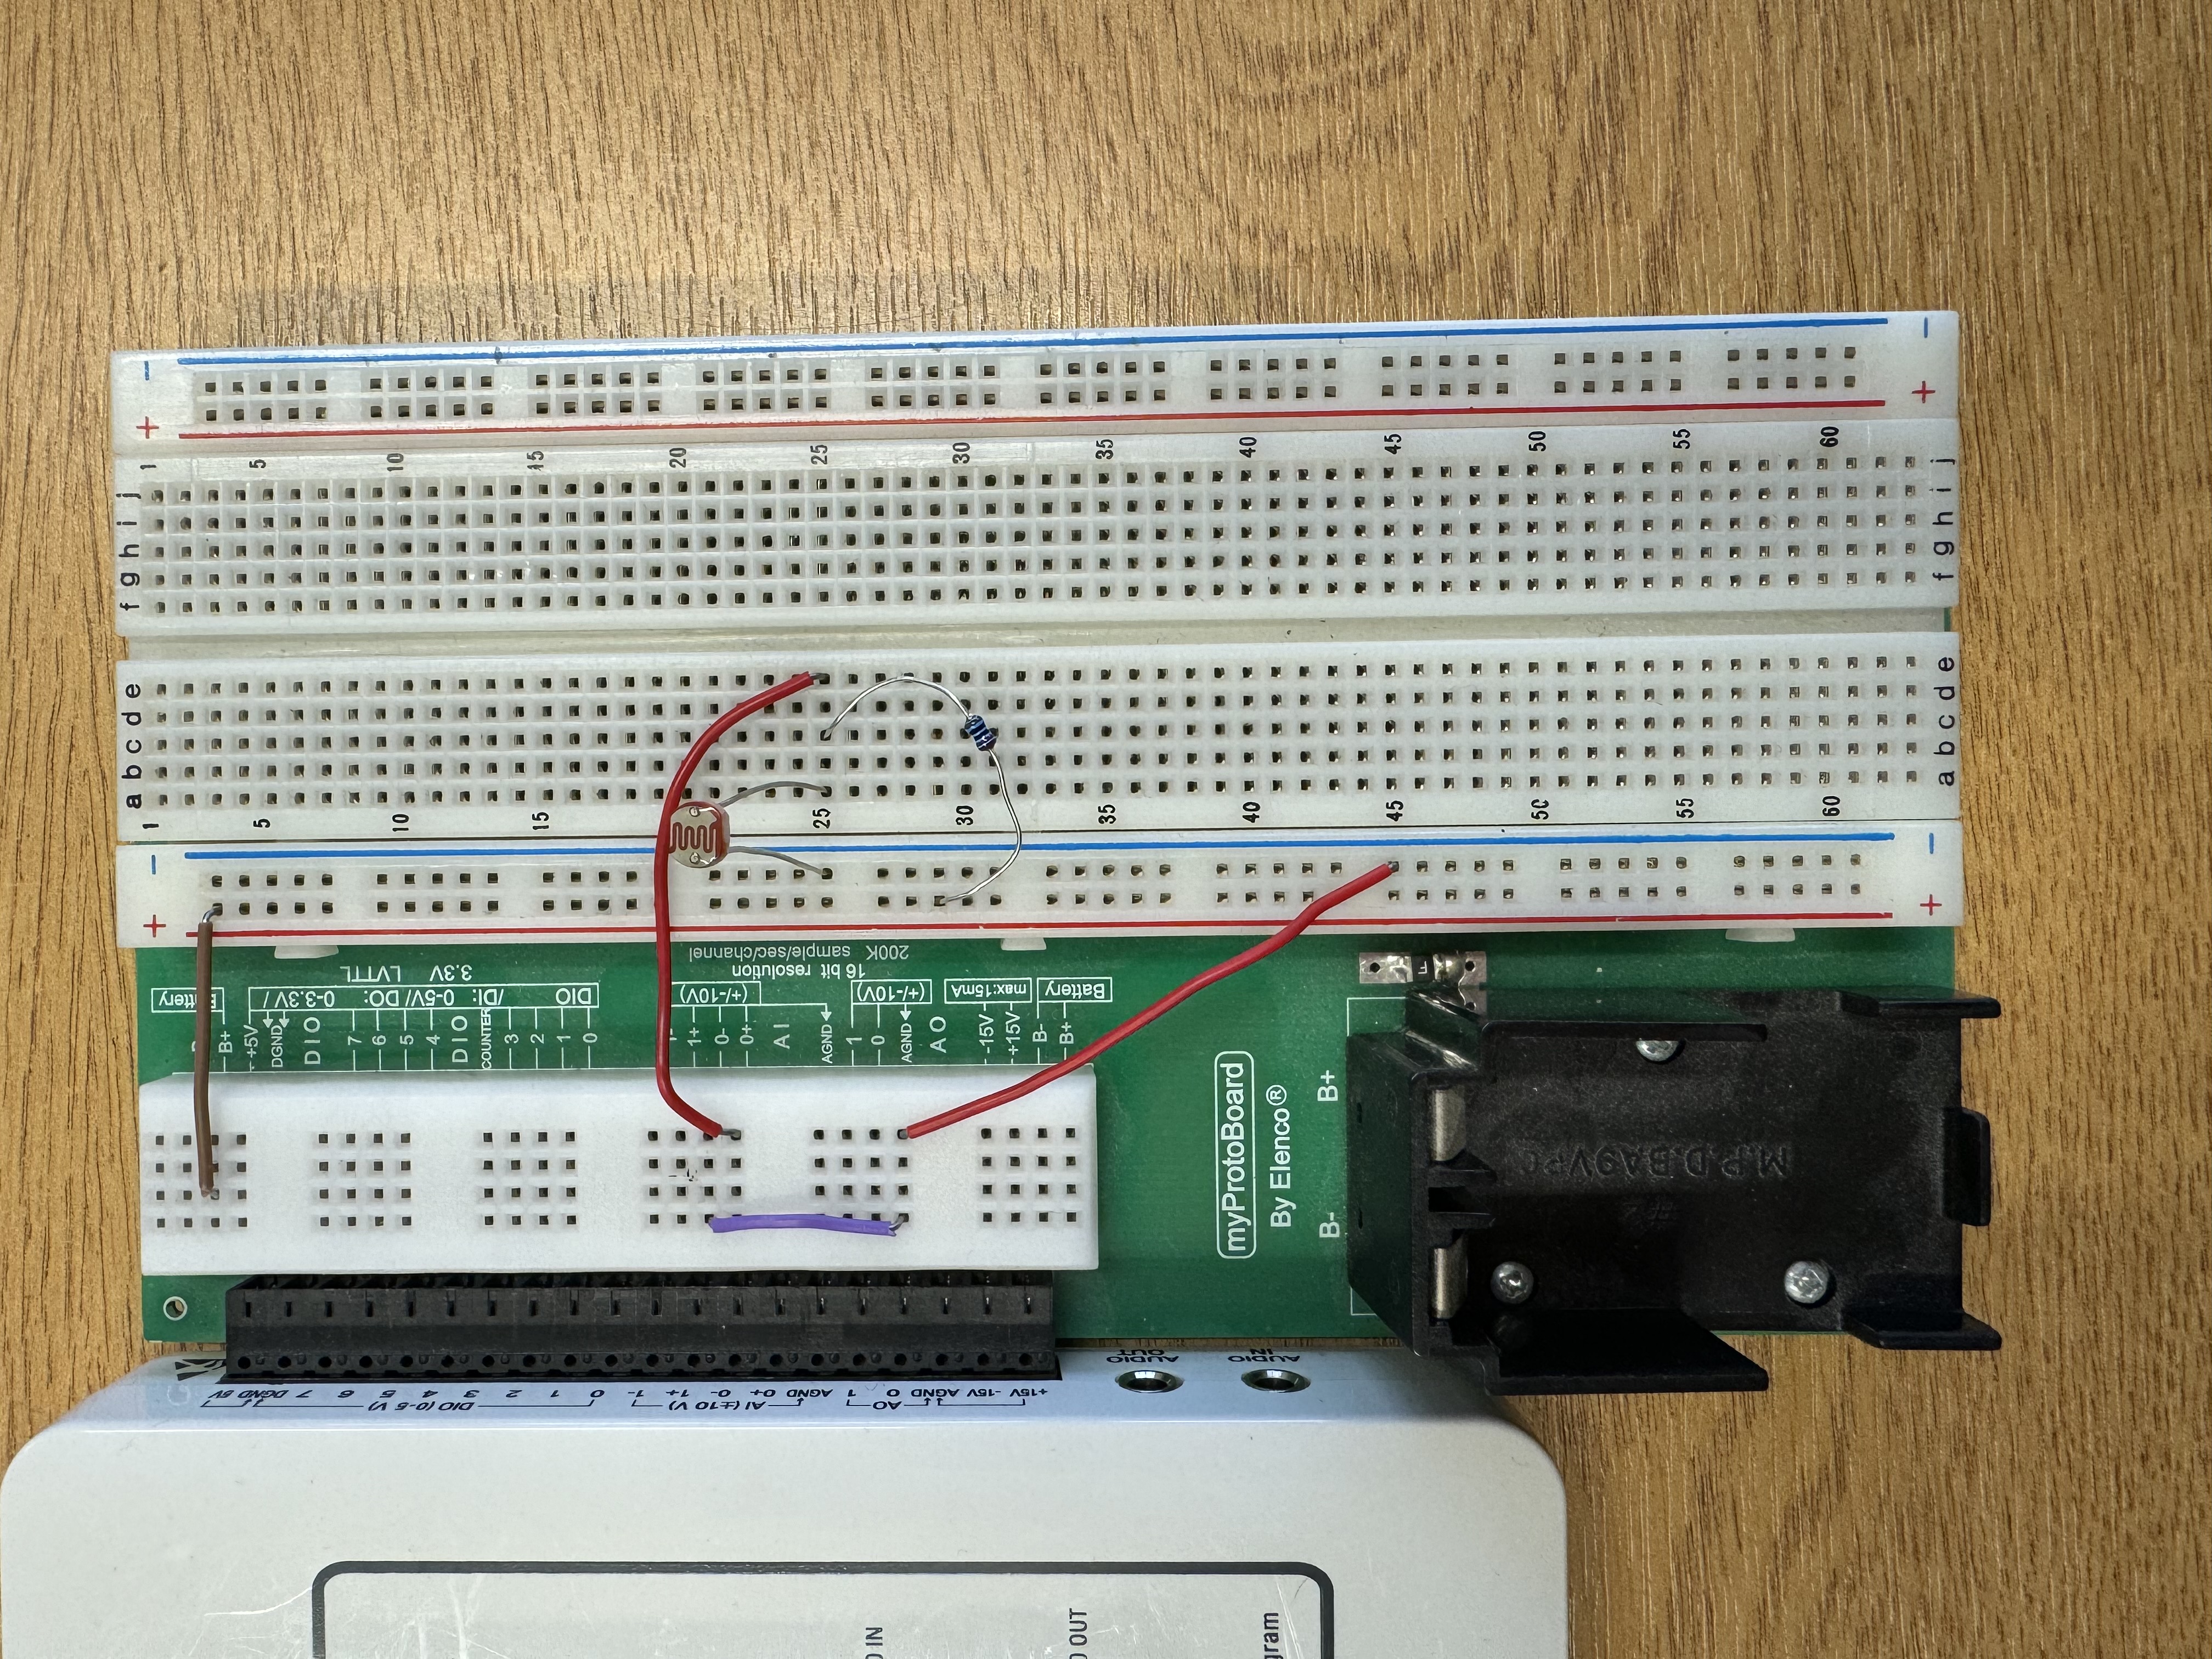
We are going to build a simple circuit which allows us to measure the intensity of a light source as a voltage using light-dependent resistor (the resistance of this element increases when exposed to light). You will be familiar with breadboards by this point for building circuits, now we are going to use a “myProtoBoard”. The myProtoBoard has an edge connector to connect to the myDAQ and a set of plugin connectors to allow connections to the circuit built on the breadboard. To build the circuit:
Connect the 5V output to the positive rail of the myProtoBoard.
Connect the analogue-ground (AGND) to the negative rail of the myProtoBoard.
Connect the analogue ground (AGND) to the analogue input channel 0\(^-\).
Connect the analogue input channel 0 minus (AI0-) to the breadboard.
Connect the light dependent resistor to the AI0- connection in the breadboard and the negative rail.
Connect the resistor to the same rail as the photosensitive-resistor and other AI0- connection and the positive rail.
Plug the myDAQ into the PC using the supplied cable.
The circuit you build should look like this:
myDAQ and LabView Walkthrough#
We will still be interfacing using LabView, this time however we will be using the software to control and take measurements from a simple electronic circuit.
In labView, find the DAQ assistant in the functions pallete (using search) and drag this into your block-diagram; a dialogue box should open. Select aquire signals, then analogue input and then voltage. A list of all the input channels for the myDAQ should appear: select the channel ai0 and press finish. Under the timing settings, set the DAQ assistant to measure one sample on demand.
Next, ensure that the VI is collecting data from the myDAQ plugged into your computer. Right-click on the device name input on the DAQ Assistant (bottom-left purple triangle) and select create control. This should make a device name drop down appear on the front panel. You can then browse this drop down and select the myDAQ that is plugged into the computer.
In the last set of activities you built a FOR loop which requires the user to know the exact number of times that the loop needs to be executed prior to running the loop. Depending on the application, this number may not always be known and instead a WHILE loop may be more appropriate to use. In this program, we will use a WHILE loop to continually collect data until a stop button on the front pannel is pressed.
Find the WHILE loop in LABVIEW and drag one around the DAQ assistant. A small stop button will appear in the bottom right corner of the loop. If there is not already one there, add a control to this loop by right-clicking and selecting create then control.
We now need to create an indicator so that we can see the output of the light-dependent resistor. Usually this can be done by hovering over the output of the DAQ assistant (bottom-right triangle), right-clicking and then chosing create and then numeric indicator or graph-indicator.
If we run this program, you will note that if you move your hand over or shine a light on the light-dependent resistor, the number in the numeric indicator and the y-axis values on the plot will change in response. The graph will update with every loop but only display one value, which is why we do not see the data being plot as a function of time. This is where the array functions become useful by allowing us to build an array of all the previously measured values.
From the functions menu in the block diagram, find the index array function and add it into the loop. Then find the insert into array function and also add this inside the loop. Right click on the loop and add the shift register. Wire these components together as follows:
Connect the output of the insert into array function and wire it to the right-hand side shift register arrow (this will store the current array of measurements and add the value of the next loop to the next row of the array).
Wire the left-hand shift register into the n-dim array input of the insert into array function.
Wire the n-dimensional array input of the index array function to the data output of the DAQ assistant.
Finally wire the output of the index array function into the n-1 input of the insert into array function.
To ensure that our graph actually displays our measurements as a function of time we can delete the wire currently serving our waveform graph (output of the DAQ assistant) and rewire it to the output of the insert into array function.
Your block digram should look something like the following:
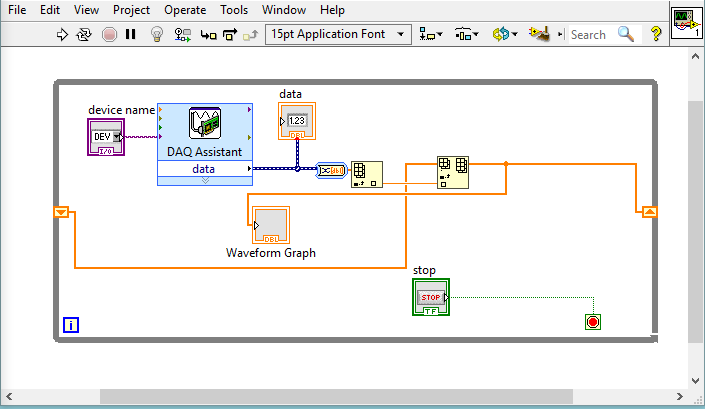
If the program is run now, the waveform graph will continually plot the measured amplitude as a function of time. If we stop and re-run the program the graph will continue to plot data from where it left off before. To clear the waveform graph each time we run the program, we can simply add a constant to the left-hand shift register. The purpose of this constant is to clear the array whenever the prgoram is run. Without it, the VI would remember every measurement that has been taken in the whole session.
Your program is now ready! Press run and move youe hand over the photodiode or shine the flash from your phone onto it and collect some cool data!
To export this data, simply stop the program, right click on the graph and select export and then your preferred export option.
Concluding Thoughts#
This may be a simple circuit and LabView script but it demonstrates how powerful computer interfacing can be in experimental Physics - running the program for just a few minutes will result in thousands of data points!
After Easter you will be performing a lab experiment to determine a value of Planck’s constant. As part of this experiment, you will build two circuits and a LabView script to control the equipment and take measurements during the experiment. In the second year of your degree many of the experiments that you do will incorporate interfacing with LabView so it is certainly worth bookmarking this webpage for future reference!
Back to Python…#
After the Easter break you will complete another Python skills task which tests your knowledge of using Pandas Dataframes and performing non-linear fits (in addition to the semester 1 Python content). The details of this task will be provided closer to the time and you will have the full workshop to attempt the skills task (which will be due the following Monday).
Please use the rest of this session to review the topics that we have covered in Python and ask for help on any that you would like additional support with.